Acquire & Plot Signals in Python
In this second tutorial we learn how to plot a sawtooth signal in real time. The signal is generated by the microcontroller on the Arduino board by sending every half a second a value. In this tutorial we do not use the Arduino firmata library but a serial library. In this case we need to use Arduino code as a driver for the microcontroller and python as a high level program. The pyserial python library is used in this tutorial. To plot this signal in real time we use two python libraries: matplotlib and drawnow. These two libraries are installed using python pip command. If you followed the Python installation procedure of tutorial 1 then, we need to open cmd prompt (for Windows OS) or terminal (for Mac OS) and navigate inside the folder Scripts by changing the current directory at the command prompt:
cd C:\Python38\Scripts
After we hit enter, we type at the command prompt
pip3 install matplotlib
And we wait for it to finish. Since we are in the Scripts directory where pip is located, we can just proceed and install the drawnow library in a similar way with
pip3 install drawnow
The following video explains in detail how we generate the signal, acquire it, and plot as we acquire it in python. Plotting data in real time gives us the ability to see whether the experimental setup works as we intended and find out whether our goals are achieved through the experiments that we perform and whether the measuremnents that we get are realistic.
The Arduino script that generates the sawtooth-like signal is shown here in this snippet. You can copy and paste it in your Arduino software and load the file onto your microcontroller. As we can see, the delay function "delay(500)" forces the Arduino microcontroller to wait 500 milliseconds between two data points. Thus, we may say that we have a sampling interval between points of dt = 0.5 seconds. The amplitude of the signal is varied by using the "if" condition in the Arduino code.
int cnt=0;
void setup() {
  Serial.begin(9600);


}

void loop() {

  Serial.println(cnt);

  cnt = cnt+1;
  delay(500);
  // Generate a sawtooth-like signal
  if (cnt > 10){
    cnt = 0;
  }

}
So far, we did not have a measure of elapsed time as we acquired signals generated by the Arduino board. We just had a sense of time by sending one value every second. To measure time, we can use the Python time library. This standard library was already installed with Python 3.7 or 3.8. We will just import it in our file alongside the other library, like this
import time
This is the Python script that grabs the serial data points, converts them in decimal numbers, appends them into an data array, and keeps plotting this data array as more points are acquired. You can copy and paste this code into a new Python file.
# --------------------------------------------------------------------------------
# This is an example of how to continually get data from a serial port,
# for example a USB connection, by using Python.
# --------------------------------------------------------------------------------

# ----------------------- Import needed libraries --------------------------------
import serial # import serial library
import matplotlib.pyplot as plt #import plotting library
from drawnow import *
import time


# ----------------- Initialize the port of interest ------------------------------
# We need to tell Python:
#    a) the same serial port where we have the arduino board plugged.
#           *  My USB says that is com6
#    b) the baud rate
#           *  It it the baude rate that the serial port uses
#           *  In the first video we set the arduino board at 9600 bits/second

arduinoSerialData = serial.Serial('com6',9600)


# -------------------- Prepare Plotting in Real Time ----------------------------
DataArray = []      # create empty array that will fill in with every new data point
Time = []           # create an empty array for time axis
time0 = time.time() # get the time when you start running this file
# -------------------------------------------------------------------------------


def Figure():                 # function that will generate a figure and keep it
                              # as long as we acquire data
    plt.plot(Time,DataArray, 'bo-') # we plot with blue color and round markers for each
                              # data point
    plt.grid(True)
    plt.grid(linestyle='dotted')
    plt.xlabel('Time, [s]')
    plt.ylabel('Amplitude, [a.u.]')

# ----------------- Poll continually the serial port for data --------------------
# Make a loop to continually read from the serial port
# we create an infinite while loop to do this

while (1==1):
    #wait until there is data on the serial port
    while (arduinoSerialData.inWaiting() == 0):
        pass
		# If there is data then we read it and we store it in a variable

    StringData = arduinoSerialData.readline() # we create a variable called myData

                                              # Python reads it as a string not as a number
    numData = float(StringData)           # Convert serial string into a number
    DataArray.append(numData)             # Load point in our DataArray


    instance = time.time()                # get the time of the data point
    Time.append(instance-time0)           # insert the absolute time value into the Time array


    drawnow(Figure)                       # Call the figure function to plot the last number
    plt.pause(0.00001)
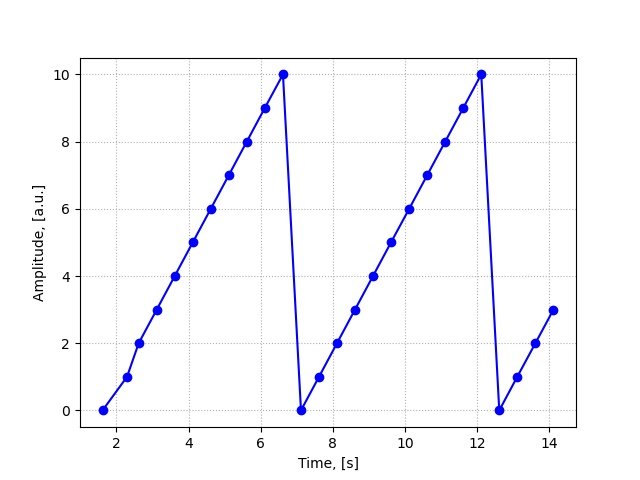
The sawtooth signal will be plot in real time. As we can see it took about 1.6 seconds to get read data from the
serial port. This sawtooth signal has an amplitude of 5 and a period T = 5.5 seconds. Thus, its frequency is
f = 1/T = 0.18 Hz