Lab1. Arduino Hardware and Software
We make measurements every day. The objective in any measurement is to answer a question. So we take
measurements to establish the value or the tendency of some variable, the results of which are
specifically targeted to answer our question. However, for an engineer, measurements provide data that needs to be processed
analyzed, interpreted, and decided upon.
Arduino boards are one of the most cost efficiently ways to perform engineering measurements
since they interface analog sensors to your computer or embedded measurements systems that you might use in an
automation environment. This following video is a tutorial that shows how to connect to an Arduino Uno board,
install the Arduino software, and upload Standard Firmata library that will give control of the board so that we can
program it in Python. This is currently the easiest and direct way to communicate with an Arduino
through a programming language other than C.
Right now, the Arduino board is ready to receive commands from the Python environment.
One thing to remember is the serial com port number that your computer has allocated to the Arduino.
Python Installation and Modules Installation from Script
Thus, to acquire data from the Arduino board, Python uses the pyfirmata module, which is a library of functions that converts python code to C, in other words it is a python wrapper for Arduino firmata protocol. It includes the serial communication, i.e. pyserial, that you might have been used before. This library gives us the ability to perform experiments and measurements for whatever process or project we work on. Through serial communication ports, such as USB ports, we are able to acquire data from sensors and control our experimental devices in real time. Like all Python libraries, pyfirmata is a module that compiles every time that we run our code and so, it will optimize to run real fast, as opposed to an "interpreted" software (MATLAB-like) that is compiled once for all time. The next video shows how we can install Python, in case that you do not already have it installed on your computer. The video also shows how to install pyfirmata directly from a python script, without the need of using a command prompt. This procedure applies for any other python library that we will use during our measurements and data analysis as long as we are running a Windows 10.
If you run on an older Windows operating system then the following code will work
well to install any python package directly from the script.
try:
	from pyfirmata import Arduino, util
except:
	import pip
	pip.main(['install','pyfirmata'])
	from pyfirmata import Arduino, util
Install Libraries with Pip on Command Prompt
Sometimes the procedure that I presented above might not work on your computer. If that is the case, then you can use the command prompt and pip function of python to install all the libraries that were created for pip-installation. The next video takes you step by step through this simple procedure.
Python Serial Communication with Pyfirmata
This first example shows how easy it is to acquire data and control electronics with
Python while using an Arduino board. To keep it simple for a start, we use a circuit having only an
LED and a resistor, other than the Arduino Uno board that is connected to the computer. We turn the
LED on and off and we measure the voltage drop as we do this. The data is then plotted in real time
and then we save this raw data in a comma separated file ('.csv') for further use and analysis.
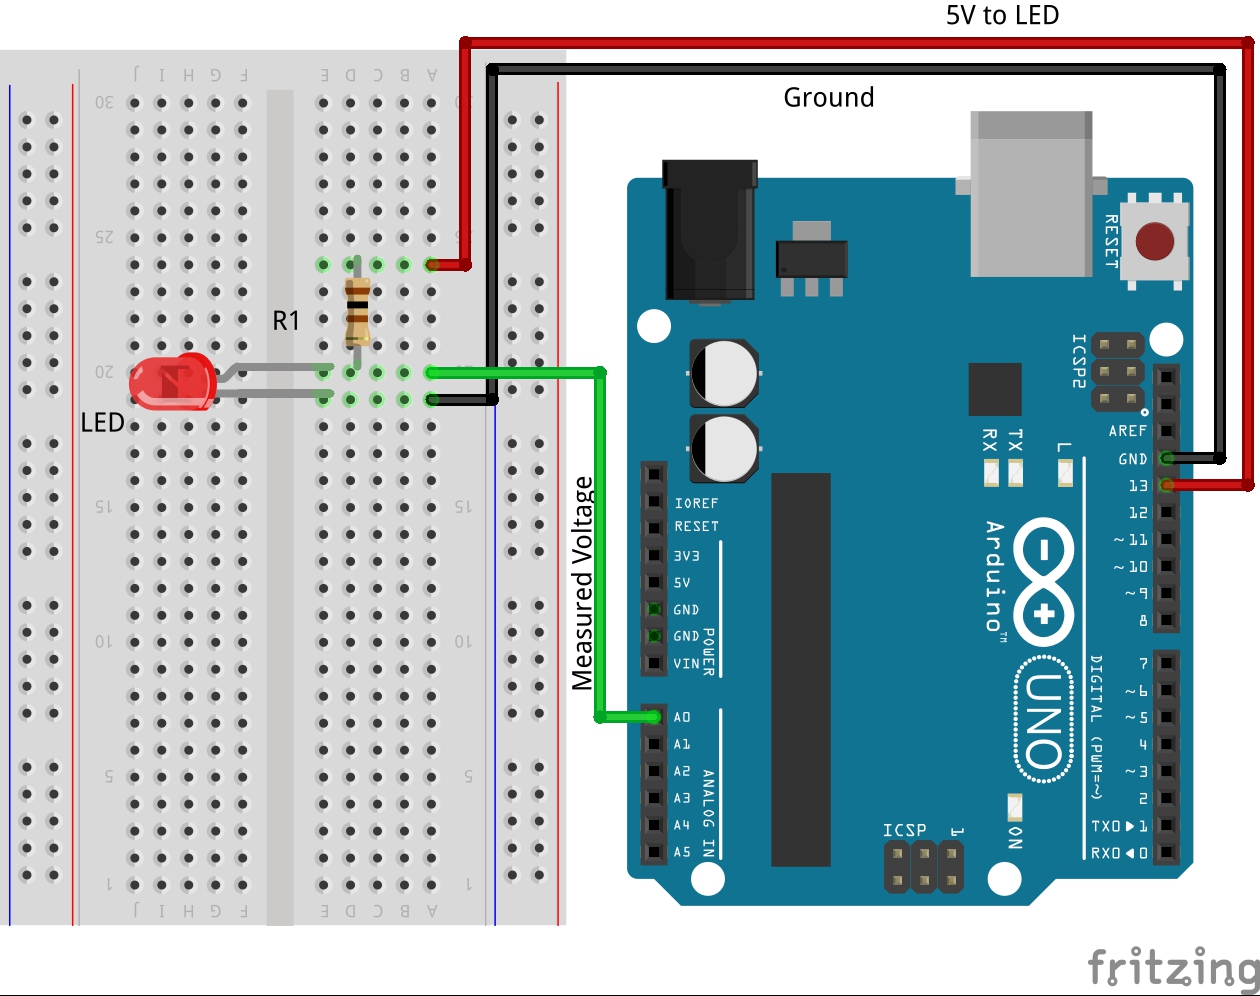
The next diagram shows how we need to wire the LED and the resistor with the Arduino
Uno board. To blink (actuate) the LED we use a digital pin, for example pin 13, and to measure the
voltage drop on the LED we simply connect an analog pin, say pin A0, as a junction between the LED
and the resistor. A resistor is needed to protect the LED since the 5 volts generated from digital
pin 13 will burn it relatively fast. A minimum value of 100 Ω will be enough to protect it.
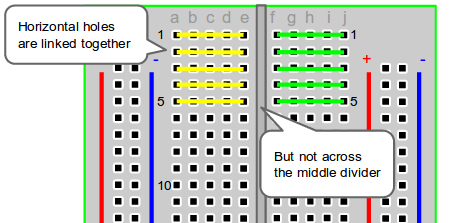
If you are not familiar with the makeup of an electronic breadboard, then the next image might be helpful.
Introduction to Python Measurements Programming
As this is the first lab, let's program the measurements in a gradual progression of difficulty, starting from simple tasks toward more complex code of continuous measurements, plotting data in real time, and saving it when we are done. If you connected the above LED circuit, then we carry out a first set of voltage measurements by turning on and off the LED. This whole procedure is presented in the following video.
1) Measure & Print One Set of Values
This is the Python code that was used in the video to interface Arduino board, turn on and off the LED, measure voltage and print its value in the IDLE shell. Please copy and paste it in your python file to run it.
# File: Lab1a_Measure_OneSetOfValues.py
# Written during Measurements Class, EGR 390, at MSU

# -------------------- Goal -------------------------------------
# Introduction to Arduino communication via python. Procedure: turn on/off a LED
# and get voltage measurements

##------------- Outline of this short code (pseudocode) -----------------
##    1) Import needed libraries such as pyfirmata, time, and numpy
##    2) Connect to the board and set pins for measurement (reading)
##          *  Need to power the LED so we can collect its voltage drop
##    3) Turn on the LED and get the voltage
##    4) Turn off the LED and get the voltage


##    1) Import needed libraries such as pyfirmata, time, and numpy
##===========================================================================
from pyfirmata import Arduino, util
import time
import numpy as np

##    2) Connect to the board and set pins for measurement (reading)
##===========================================================================
board = Arduino('COM3')# tell python that our Arduino is connected to the serial port COM3
                        # COM3 is for my laptop configuration. Your's might be different

# Now, we use util to start an iterator that allows us to read from the board
iterator = util.Iterator(board)
iterator.start()

time.sleep(1.0)# wait 1 sec. Sometimes this helps to give time for communication
               #in order to get an actual value and not get 'None' value

##    3) Turn on the LED & Measure Voltage Drop
##===========================================================================
LED = board.get_pin('d:13:o')# assign the digital pin 13 as an output to power the LED
LED.write(1)# write a digital 1 meaning 5V to pin 13

Measured = board.get_pin('a:0:i')# assign the analog pin 0 as an input to
                                ## measure the voltage drop on the LED
time.sleep(0.05)# wait 50 milisec. Sometimes this helps to give time for communication
               #in order to get an actual value and not get 'None' value
               # If you get a 'None' value increase the pause time
               # This is very useful as the Arduino is runs much slower than your computer

Measured_Voltage = Measured.read()# measure the voltage on LED. It's a scaled value
                                  # between 0 and 1
Voltage = Measured_Voltage*5.0 # convert scaled value, i.e. 0 to 1, to actual voltage
print('First value = ',Voltage)

##    4) Turn off the LED & Measure Voltage Drop
##===========================================================================
LED.write(0)# write a digital 0 meaning 0V to pin 13
time.sleep(0.1)# wait 100 milisec. to give more time to the board to prepare the
                # second reading for us. The computer is much faster

Measured_Voltage = Measured.read()# measure the voltage on LED
Voltage = Measured_Voltage*5.0
print('Second Value = ',Voltage)
2) Continuously Measure Voltage
Now we want to improve the previous code to run continuously and take measurements. For this it is recommendable to save the previous file with a different name, say Lab1b_Measure_Continuously.py. We will make several modifications as explained in the next video and shown in the next code snippet. In the end, please copy the following code and run it on your computer. Do not forget to adjust the com-port for your machine.
# File: Lab1b_Measure_Continuously.py
# Written during Measurements Class, EGR 390, at MSU

# -------------------- Goal -------------------------------------
#Adjust the previous code, Lab1a_Measure_OneSetOfValues.py to continuously
# measure the voltage drop on the LED while we continuously turn it on & off.

##------------- Outline of this short code (pseudocode) -----------------
##    1) Import needed libraries such as pyfirmata, time, and numpy
##    2) Connect to the board and set pins for measurement (reading)
##          *  Need to power the LED so we can collect its voltage drop
##    3) Continuously  turn on and off the LED while we measure voltage


##    1) Import needed libraries such as pyfirmata, time, and numpy
##===========================================================================
from pyfirmata import Arduino, util
import time
import numpy as np

##    2) Connect to the board and set pins for measurement (reading)
##===========================================================================
board = Arduino('COM3')

# Now, we use util to start an iterator that allows us to read from the board
iterator = util.Iterator(board)
iterator.start()

time.sleep(1.0)# wait 1 sec. Sometimes this helps to give time for communication
               #in order to get an actual value and not get 'None' value

# Define the pins that we access
LED = board.get_pin('d:13:o')# assign the digital pin 13 as an output
Measured = board.get_pin('a:0:i')# assign the analog pin 0 as an input to
                                ## measure the voltage drop on the LED


#     3) Continuously turn on and off the LED while we measure voltage
##===========================================================================
# For this we create an infinte Loop to run continuously
while(True):
    LED.write(1)# write a digital 1 meaning 5V to pin 13

    time.sleep(1)# keep it on for 1 second

    Measured_Voltage = Measured.read()# measure the voltage on LED
    Voltage = Measured_Voltage*5.0
    print('First value = ',Voltage)


    LED.write(0)# write a digital 0 meaning 0V to pin 13
    time.sleep(1)# keep it off for a second

    Measured_Voltage = Measured.read()# measure the voltage on LED
    Voltage = Measured_Voltage*5.0
    print('Second Value = ',Voltage)
3) Plot Data in Real Time
Engineers need to plot the measured data in real time so they can see that what they are doing is good and otherwise correct their measurement setup if is needed. Thus, plotting data in real time is very useful during the design stage of a measurement setup. Sometimes, it can also be useful for any user of the measurement setup. In the next video we we define a function called "Figure" that we grab the measured data and plot it after each measurement iteration. We still turn the LED on and off and keep measuring its voltage drop. To plot our data in python, we need two more libraries: matplotlib and drawnow. If you do not have these libraries installed on your computer please watch the video presented above in the subsection "Install Libraries with Pip on Command Prompt". The next code snippet is organized as the pseudo-code outline. Please copy the following code and run it on your computer.
# File: Lab1c_Measure_Continuously_AndPlot.py
# Written during Measurements Class, EGR 390, at Murray State University

# -------------------- Goal -------------------------------------
#Adjust the previous code, Lab1b__Measure_Continuously.py to plot data in
#real time while we continuously measure the voltage drop on the LED that we
#continuously turn it on & off to simulate an automation process.

##------------- Outline of this short code (pseudocode) -----------------
##    1) Import needed libraries such as pyfirmata, time, and numpy
##    2) Connect to the board and set pins for measurement (reading)
##          *  Need to power the LED so we can collect its voltage drop
##    3) Define a function in python that will plot our measured data in
##        real time
##    4) Continuously  turn on and off the LED while we measure voltage
##        and then plot it after each iterative measurement
#-----------------------------------------------------------------------


##    1) Import needed libraries such as pyfirmata, time, and numpy, etc.
##===========================================================================
from pyfirmata import Arduino, util
import time
import numpy as np
import matplotlib.pyplot as plt #import plotting library
from drawnow import * # import all functions within the drawnow library.


##    2) Connect to the board and set pins for measurement (reading)
##===========================================================================
board = Arduino('COM3')

# Now, we use util to start an iterator that allows us to read from the board
iterator = util.Iterator(board)
iterator.start()

time.sleep(1.0)# wait 1 sec. Sometimes this helps to give time for communication
               #in order to get an actual value and not get 'None' value

# Define the pins that we access
LED = board.get_pin('d:13:o')# assign the digital pin 13 as an output
Measured = board.get_pin('a:0:i')# assign the analog pin 0 as an input to
                                ## measure the voltage drop on the LED


##    3) Define a function in python that will plot our measured data in real time
##===========================================================================

def Figure():
    plt.plot(Time,VoltageArray, 'bo-', markersize=5) # we plot with blue color and round markers for each
                              # data point
    plt.xlabel('Time, [s]')
    plt.ylabel('Voltage, [V]')
    plt.grid(color='gray', linestyle=':', linewidth=0.5)


# -------------------- Prepare Plotting in Real Time ----------------------------
VoltageArray = [] # create empty array that will fill in with every new data point
Time = []         # create an empty array for time axis


##    4) Continuously  turn on and off the LED while we measure voltage
##        and then plot it after each iterative measurement
##===========================================================================

time0 = time.time() # get the time when you start running this file
# Create an infinte Loop to run continuously
while(True):
    LED.write(1)# write a digital 1 meaning 5V to pin 13
    time.sleep(0.05)# wait 1 sec. Sometimes this helps to give time for communication
               #in order to get an actual value and not get 'None' value

    Measured_Voltage = Measured.read()# measure the voltage on LED
    instance = time.time()         # get the time of the measured voltage
    Abs_time = instance-time0      # calculate an absolute value of time with 0 when we
                                       # pressed the Run button of Python

    Voltage = np.multiply(Measured_Voltage,5)# convert to actual volts
    VoltageArray.append(Voltage)      # Load distance point in our DataArray
    Time.append(Abs_time)          # insert the absolute time value into the Time array
    print('First value = ',Voltage)


    LED.write(0)# write a digital 0 meaning 0V to pin 13
    time.sleep(0.05)# wait 1 sec. Sometimes this helps to give time for communication
               #in order to get an actual value and not get 'None' value


    Measured_Voltage = Measured.read()# measure the voltage on LED
    instance = time.time()         # get the time of the measured voltage
    Abs_time = instance-time0      # calculate an absolute value of time with 0 when we
                                       # pressed the Run button of Python

    Voltage = Measured_Voltage*5.0
    VoltageArray.append(Voltage)      # Load distance point in our DataArray
    Time.append(Abs_time)          # insert the absolute time value into the Time array

    print('Second Value = ',Voltage)
    drawnow(Figure)
    plt.pause(0.01)
4) Plot Data in Real Time and Save it
Most of the time during design stage of a measurement setup, we need to keep our data for further post-processing goals. This video shows how we can measure a square wave voltage drop on a LED that simulates an automation process. We plot this data in real time, and then save it in a comma separated file (.csv). The next code snippet is organized as the pseudo-code outline. This python code is on the previous script and adjusted so that it turns the LED on and off to follow a square wave that we plot it in real time and then we save the data. Please copy the following code and run it on your computer.
# File: Lab1d_Measure_Continuously_Plot_andSaveData.py
# Written during Measurements Class, EGR 390, at Murray State University

# -------------------- Goal -------------------------------------
#Adjust the previous code, Lab1c_Measure_Continuously_AndPlot.py to plot data in
#real time while we continuously measure the voltage drop on the LED that we
#continuously turn it on & off to simulate an automation process.
# Moreover, at the end of the measurements we want to keep our data for
# post-processing

##------------- Outline of this short code (pseudocode) -----------------
##    1) Import needed libraries such as pyfirmata, time, and numpy
##    2) Connect to the board and set pins for measurement (reading)
##          *  Need to power the LED so we can collect its voltage drop
##    3) Define a function in python that will plot our measured data in
##        real time
##    4) Continuously  turn on and off the LED while we measure voltage
##        and then plot it after each iterative measurement
##    5) Save data in a spreadsheet, a comma separated file, .csv
#-----------------------------------------------------------------------


##    1) Import needed libraries such as pyfirmata, time, and numpy, etc.
##===========================================================================
from pyfirmata import Arduino, util
import time
import numpy as np
import matplotlib.pyplot as plt #import plotting library
from drawnow import * # import all functions within the drawnow library.


##    2) Connect to the board and set pins for measurement (reading)
##===========================================================================
board = Arduino('COM3')

# Now, we use util to start an iterator that allows us to read from the board
iterator = util.Iterator(board)
iterator.start()

time.sleep(1.0)# wait 1 sec. Sometimes this helps to give time for communication
               #in order to get an actual value and not get 'None' value

# Define the pins that we access
LED = board.get_pin('d:13:o')# assign the digital pin 13 as an output
Measured = board.get_pin('a:0:i')# assign the analog pin 0 as an input to
                                ## measure the voltage drop on the LED


##    3) Define a function in python that will plot our measured data in real time
##===========================================================================

def Figure():
    plt.plot(Time,VoltageArray, 'bo-', markersize=5) # we plot with blue color and round markers for each
                              # data point
    plt.xlabel('Time, [s]')
    plt.ylabel('Voltage, [V]')
    plt.grid(color='gray', linestyle=':', linewidth=0.5)

# -------------------- Prepare Plotting in Real Time ----------------------------
VoltageArray = [] # create empty array that will fill in with every new data point
Time = []         # create an empty array for time axis


##    4) Continuously  turn on and off the LED while we measure voltage
##        and then plot it after each iterative measurement
##===========================================================================

# --------- Continually turn the LED on and off & Measure Voltage -------------
value = 20
time0 = time.time() # get the time when you start running this file
# Create an infinte Loop to run continuously
try:
    while(True):
        for x in range(value):
            LED.write(1)# write a digital 1 meaning 5V to pin 13
            time.sleep(0.05)# wait 50 milisec. Sometimes this helps to give time for communication
                           #in order to get an actual value and not get 'None' value

            Measured_Voltage = Measured.read()# measure the voltage on LED
            instance = time.time()  # get the time of the measured voltage
            Abs_time = instance-time0# calculate an absolute value of time with 0 when we
                                                   # pressed the Run button of Python
            Voltage = Measured_Voltage*5.0# convert to actual volts
            VoltageArray.append(Voltage)      # Load distance point in our DataArray
            Time.append(Abs_time)          # insert the absolute time value into the Time array
            print('First value = ',Voltage)


        for x in range(value):
            LED.write(0)# write a digital 0 meaning 0V to pin 13
            time.sleep(0.05)# wait 50 milisec. Sometimes this helps to give time for communication
                        #in order to get an actual value and not get 'None' value


            Measured_Voltage = Measured.read()# measure the voltage on LED
            instance = time.time()         # get the time of the measured voltage
            Abs_time = instance-time0      # calculate an absolute value of time with 0 when we
                                            # pressed the Run button of Python
            Voltage = Measured_Voltage*5.0
            VoltageArray.append(Voltage)      # Load distance point in our DataArray
            Time.append(Abs_time)          # insert the absolute time value into the Time array

            print('Second Value = ',Voltage)
        drawnow(Figure)
        plt.pause(0.01)
except KeyboardInterrupt:
    print("Press Ctrl-C to terminate while statement")
    pass


##    5) Save data in a spreadsheet, a comma separated file, .csv
##===========================================================================

# We need to take the two line arrays, Time and VoltageArray, and join them
# together to form a 2D array with Time as first column and Voltage as
# second column.
# The savetxt function uses a format with 3 decimal points, i.e. fmt="%1.3f"
data = np.stack((Time, VoltageArray), axis=1)
print('Data ', data)
np.savetxt('Voltage_Measurements_Midpoint.csv',data,delimiter=",", header="Time [s],Voltage [V]",
           fmt="%1.3f", comments='')