Distance Measurements
Distance measurements is one of the most used engineering measurements wherever object motion is involved. Several other measurements, such as position, displacement, velocity, acceleration can be calculated based on measuring the distance from a transducer to an object in motion. Distance measurement transducers could be developed based on resistive, capacitive, inductive properties of the sensor. Others are based on the properties of a medium wherein a wave propagates, such as a sound or electromagnetic waves, i.e. radar, laser. Acoustic location such as sonar has a wide range of applications in modern engineering. After all, this bio-inspired technique allows animals for example in bats, dolphins, and orcas to hunt with astonishing precision, sometimes very small pray. Here, we introduce an ultrasonic technique to measure distance, plot it in real time, and save data for later statistical analysis with Python.
Ultrasonic Transducer
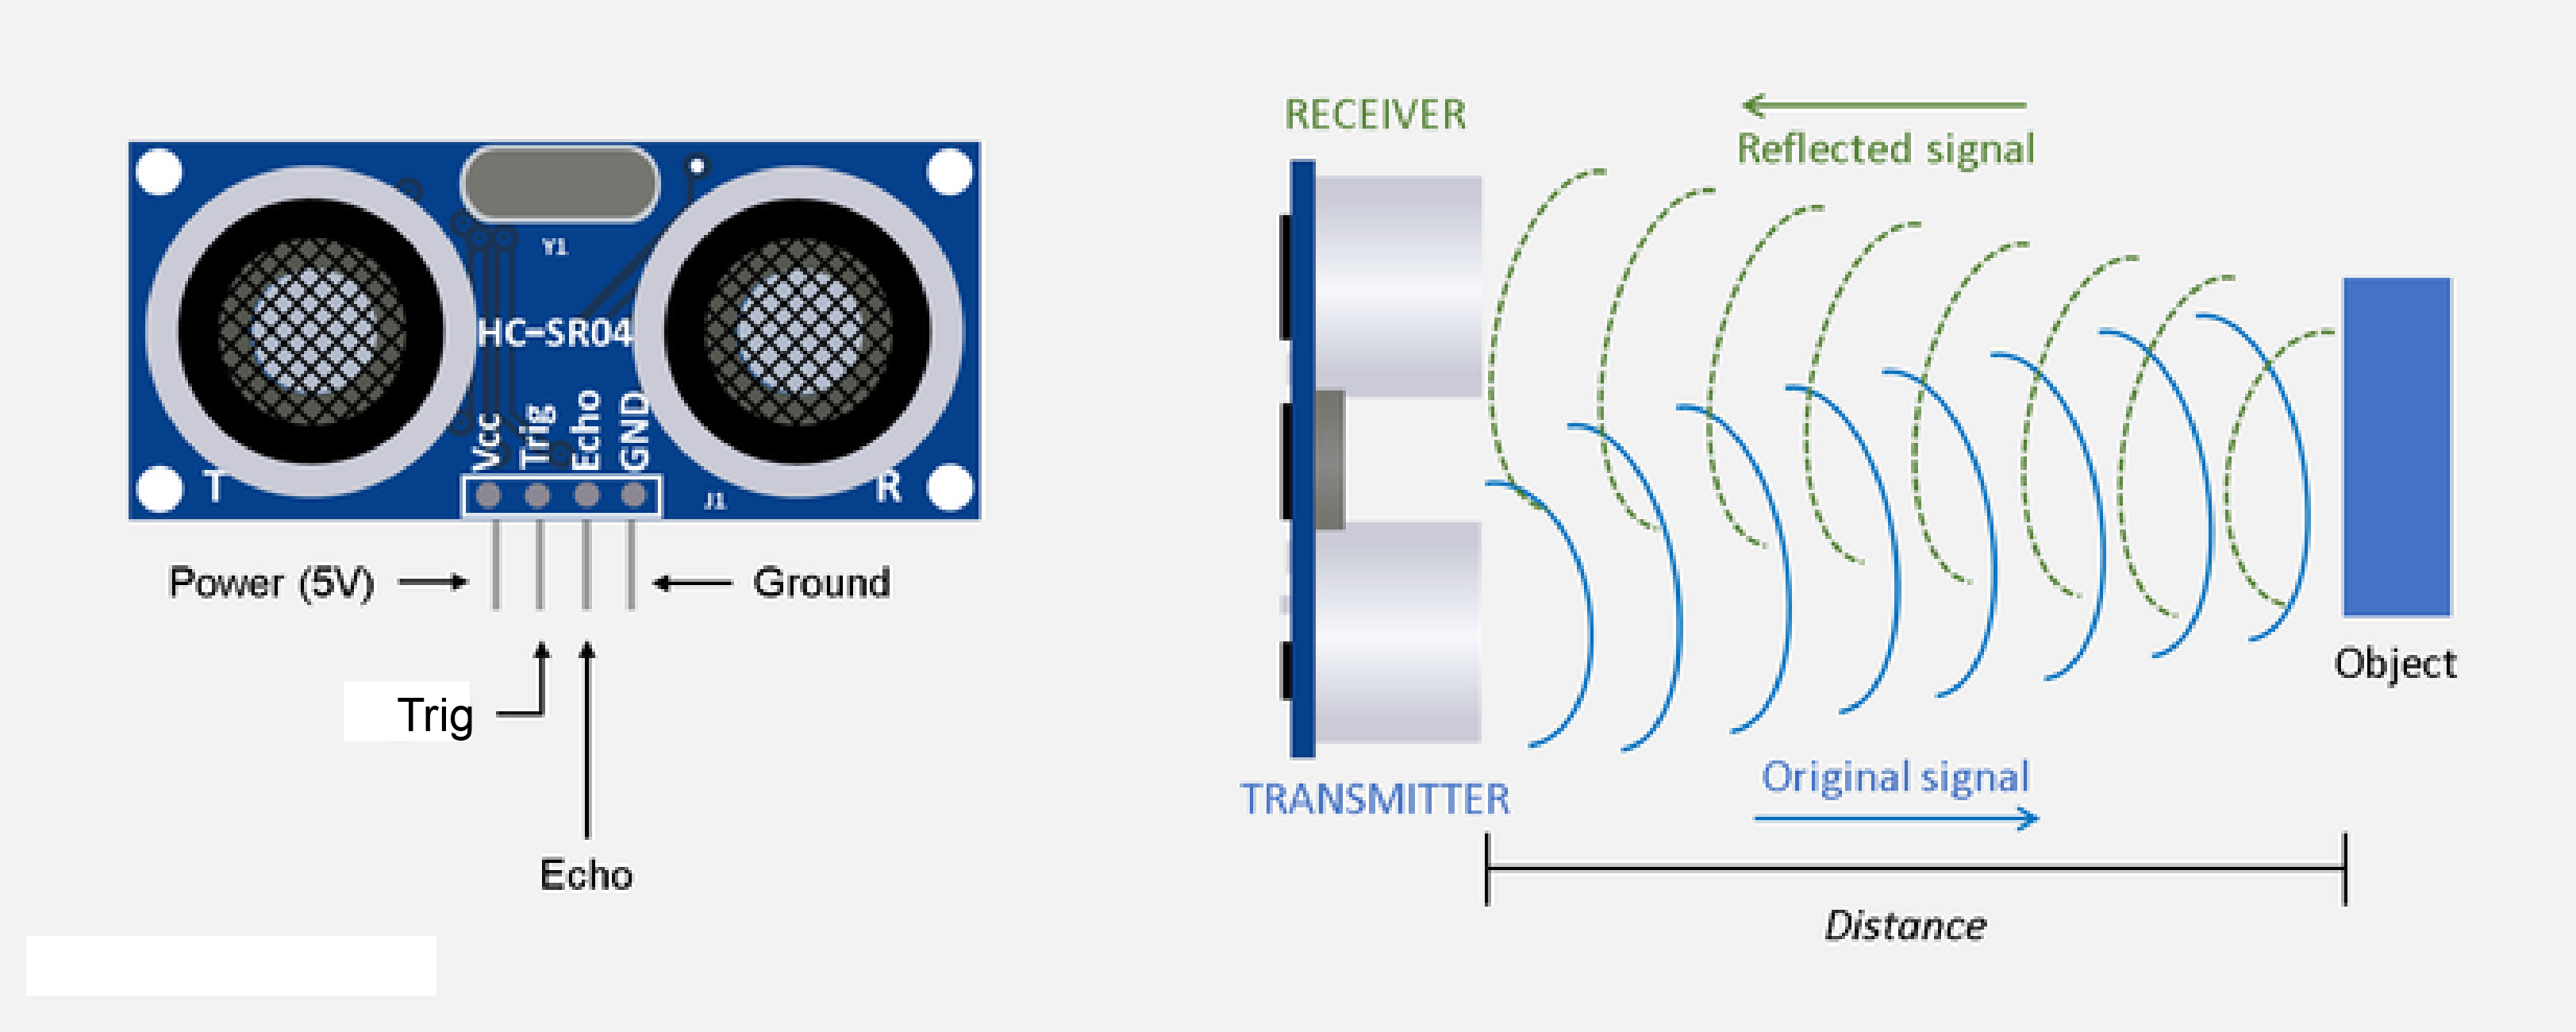
One simple and cost effective ultrasonic transducer for distance measurements is the HC-SR04. This ultrasonic sensor has a transmitter and a receiver. When excited with a voltage, the transmitter sends an ultrasonic wave in the form of a ping of frequency 40 kHz. The ping travels through the air until it hits an object and it bounces back toward the sensor where the receiver transforms the sonic wave back into a voltage. We cannot hear the ping since its frequency is outside the absolute limits of human hearing, i.e. 20 Hz to 20 kHz. Moreover, our hearing is most sensitive in the range of 2 - 5kHz.
The datasheet of the HC-SR04 transducer indicates several features about its functionality:
- Power Supply: +5V DC
- Quiescent Current: < 2 mA
- Working Current: 15 mA
- Effectual Angle: <15°
- Ranging Distance: 2cm - 400 cm or 1 inch - 13ft
- Resolution: 0.3 cm
- Measuring Angle: 30°
- Trigger Input Pulse width: 10 µs
The sensor has four pins:
- The VCC pin, the pin the powers the sensor. We connect this to 5V on Arduino board
- The Trig pin, the trigger which excites the transmitter. We will use a square wave to send the ping, i.e. the air vibration. We connect this to pin 13 on the board.
- The Echo pin, is the one connected to the receiver. It will give us back the electric voltage corresponding to the return wave. We connect the Echo pin on pin 11 on the Arduino board.
- The ground pin that we connect it to one of the several GND pins on the Arduino board.
Even though the sound wave is an analog signal, we are not able to record the entire wave since the serial communication of the Arduino board is the limiting factor to sample the waveform. One way of taking distance measurements with the Arduino Uno board is to connect the transducer as in the following diagram
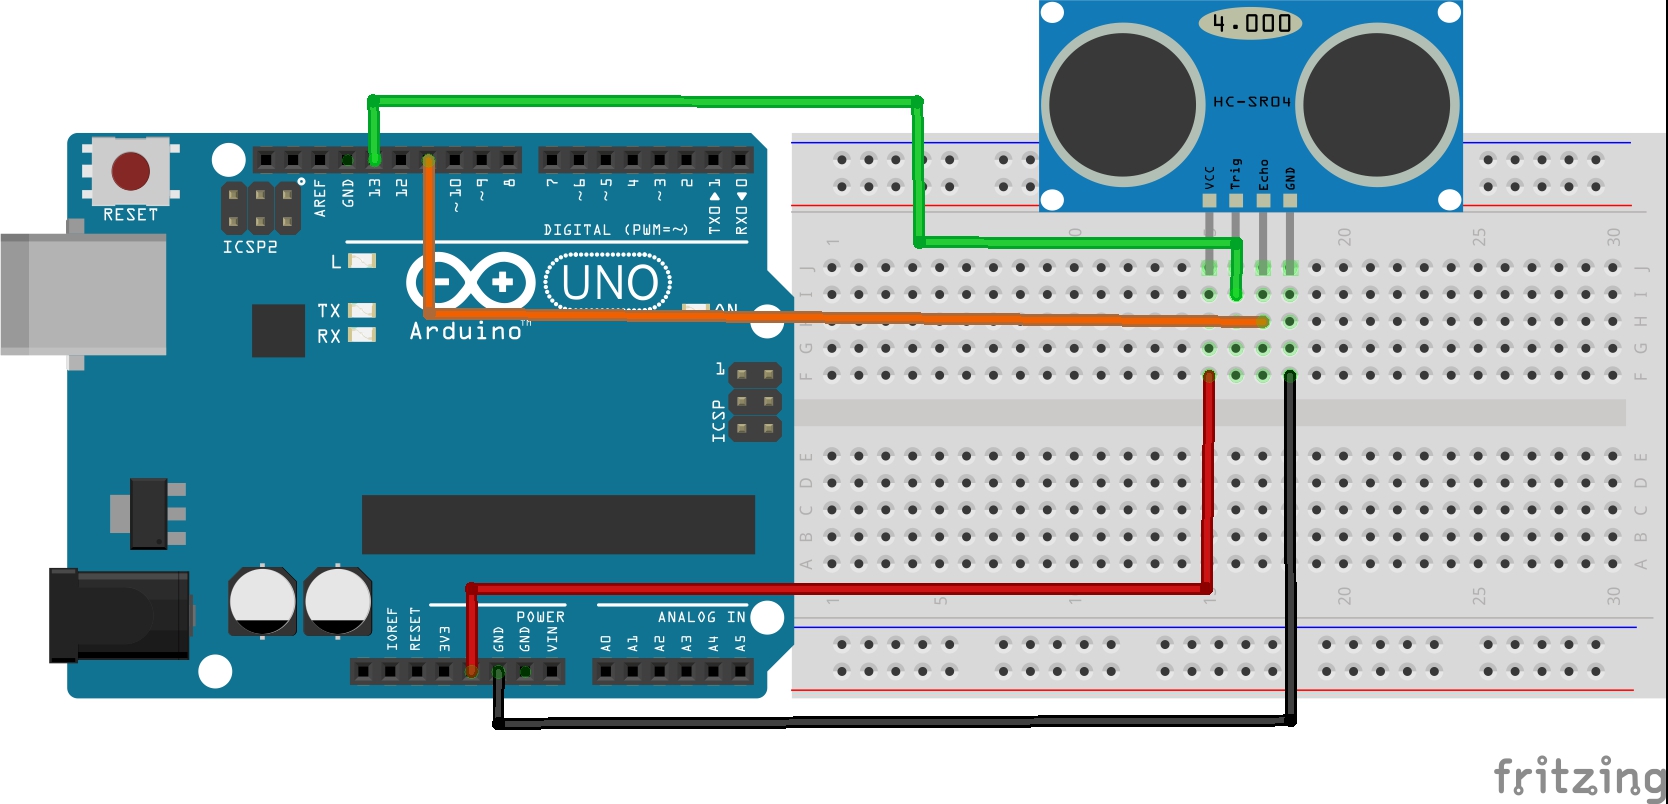
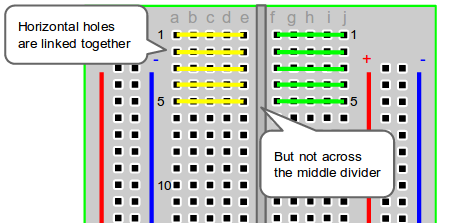
If you are not familiar with the makeup of an electronic breadboard, then the next image might be helpful
The following video shows how we can take measurements based on this experimental setup. It explains some of the problems and a little about the code that we should put in the Arduino board as well as the one for acquiring data with Python.
Arduino Hardware Measurement Control
The Arduino script that generates generates an ultrasonic ping and listens to the echo is shown in the following snippet. To generate the sound wave, the transmitter is excited with a square pulse by triggering its pin low-high-low, meaning 0V-5V-0V. The sensor will output a HIGH pulse on its echo pin, and the length of the pulse in microseconds indicates the time (also called the time of flight) it took the ping to travel to the target and return. To convert the time of fligt into distance between the sensor and the object we use the speed of sound in air which is approximately constant, depending on the temperature and pressure of the air. Special thanks go to Paul McWhorter from toptechboy.com for developing this simple and elegant Arduino coding example.
int trigPin=13; //Sensor Trig pin connected to Arduino pin 13
int echoPin=11;  //Sensor Echo pin connected to Arduino pin 11
float pingTime;  //time for ping to travel from sensor to target and return
float targetDistance; //Distance to Target in inches
float speedOfSound=776.5; //Speed of sound in miles per hour when temp is 77 degrees.

void setup() {
  // put your setup code here, to run once:
  Serial.begin(9600);
  pinMode(trigPin, OUTPUT);
  pinMode(echoPin, INPUT);
}

void loop() {
  // put your main code here, to run repeatedly:

  digitalWrite(trigPin, LOW); //Set trigger pin low
  delayMicroseconds(2000); //Let signal settle
  digitalWrite(trigPin, HIGH); //Set trigPin high
  delayMicroseconds(15); //Delay in high state
  digitalWrite(trigPin, LOW); //ping has now been sent
  delayMicroseconds(10); //Delay in low state

  pingTime = pulseIn(echoPin, HIGH);  //pingTime is presented in microceconds
  pingTime=pingTime/1000000; //convert pingTime to seconds by dividing by 1000000 (microseconds in a second)
  pingTime=pingTime/3600; //convert pingtime to hourse by dividing by 3600 (seconds in an hour)
  targetDistance= speedOfSound * pingTime;  //This will be in miles, since speed of sound was miles per hour
  targetDistance=targetDistance/2; //Remember ping travels to target and back from target,
                                   //so you must divide by 2 for actual target distance.
  targetDistance= targetDistance*63360;    //Convert miles to inches by multipling by 63360 (inches per mile)

  Serial.println(targetDistance);

  delay(1000); //delay tenth of a  second to slow things down a little.
}
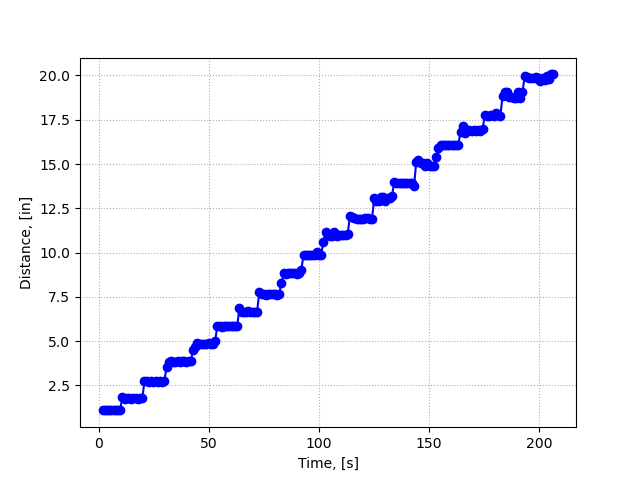
Acquiring, Plotting, and Saving Data with Python
The Python script that we will use is based on the one that was written for the previous assignment. In addition to acquiring data from the serial port, logging the time of each acquisition, plotting these measurements, we want to save this acquired data in a spreadsheet for later analysis. For this we will use the numerical Python library called numpy to format our data in a 2-dimensional array that will be saved in the spreadsheet. The time in seconds will be place in the first column and the measured distance in inches will be in the second column. As in the previous assignment, we use a infinite while loop to measure distance. At the end of the measureemnts we want to stop the measurements without losing the plot and saving data. The simplest way to stop the measurements by interrupting this while loop and save the data is to use a try/except structure like this:
	try:
		while True:
			do_something()
	except KeyboardInterrupt:
		pass
The following Python script was adopted from the previous assignment to take our measurements as shown in the video. You can copy and paste this code into a new Python file.
# --------------------------------------------------------------------------------
# This is an example code of how to continually get data from a serial port,
# for example a USB connection, plot the data in real-time, and when we
# are done save this data in a spreadsheet as a coma separated file (.csv)
# --------------------------------------------------------------------------------

# ----------------------- Import needed libraries --------------------------------
import serial # import serial library
import matplotlib.pyplot as plt #import plotting library
from drawnow import *
import time
import numpy as np


# ----------------- Initialize the port of interest ------------------------------
# We need to tell Python:
#    a) the same serial port where we have the arduino board plugged.
#           *  My USB says that is com6
#    b) the baud rate
#           *  It it the baude rate that the serial port uses
#           *  In the first video we set the arduino board at 9600 bits/second

arduinoSerialData = serial.Serial('com6',9600)


# -------------------- Prepare Plotting in Real Time ----------------------------
DataArray = []      # create empty array that will fill in with every new data point
Time = []           # create an empty array for time axis
time0 = time.time() # get the time when you start running this file
# -------------------------------------------------------------------------------


def Figure():                 # function that will generate a figure and keep it
                              # as long as we acquire data
    plt.plot(Time,DataArray, 'bo-', markersize=5) # we plot with blue color and round markers for each
                              # data point
    plt.grid(True)
    plt.grid(linestyle='dotted')
    plt.xlabel('Time, [s]')
    plt.ylabel('Distance, [in]')

# ----------------- Poll continually the serial port for data --------------------
# Make a loop to continually read from the serial port
# we create an infinite while loop to do this

try:
    while (True):
        #wait until there is data on the serial port
        while (arduinoSerialData.inWaiting() == 0):
            pass
                    # If there is data then we read it and we store it in a variable

        StringData = arduinoSerialData.readline() # we create a variable called myData

                                       # Python reads it as a string not as a number
        numData = float(StringData)    # Convert serial string into a number
        DataArray.append(numData)      # Load distance point in our DataArray


        instance = time.time()         # get the time of the data point
        Abs_time = instance-time0      # calculate an absolute value of time with 0 when we
                                       # pressed the Run button of Python
        Time.append(Abs_time)          # insert the absolute time value into the Time array

        drawnow(Figure)                       # Call the figure function to plot the last number
        plt.pause(0.00001)

except KeyboardInterrupt:
    print("Press Ctrl-C to terminate while statement")
    pass

# -------------------------------- Save data in csv file -------------------
# We need to take the two line arrays, Time and DataArray, and join them
# together to form a 2D array with Time as first column and Distance as
# second column.
# The savetxt function uses a format with 3 decimal points, i.e. fmt="%1.3f"
data = np.stack((Time, DataArray), axis=1)
print('Data ', data)
np.savetxt('Distance_Measurement_Aluminum_block.csv',data,delimiter=",", header="Time [s],Distance [in]",
           fmt="%1.3f", comments='')
The accuracy of the measurements is influenced by the medium from where the sonic ping bounces back.
For example, the wood block exhibited less accurate measurements due to its sound absorption properties.