|
Statistics and Significance Adapted from "Determining confidence: sex and statistics" by T. L. Derting et al., 2005 |
Goals: As you conducted your research
projects and discussed various experiments in class, you may have
wondered how one determines whether an experimental treatment truly
has a biological effect, or whether differences among experimental
groups are simply due to chance. The following activity is
designed to guide your exploration of statistics by:
Objectives: Students will be able to:
|
| Sample Size and Confidence In your groups, think about the following scenario and then answer the questions which follow : Suppose you are the head of a drug-testing team. You have obtained positive results from in-vitro experimental tests on human cells and are now ready to test the drug on a sample of humans. You have a pool of 10,000 people on whom to test the drug. 
|
| Probability Values and Confidence Based on discussion of your responses to the questions above, it is expected that you realize that sample size is important in determining the impact of chance effects on experimental outcomes. Confidence in an experimental outcome is usually much improved as you increase your sample size. Consideration of sample size alone does not, however, tell us the probability that differences among experimental groups are real and not just due to chance. Scientists use probability values (i.e., P-values) that are associated with specific statistical tests to decide whether differences in outcomes among experimental groups are real. Here you will apply your understanding of P-values and statistical outcomes using data from a published scientific article. As you work on the problems below, use sections 8.1 and 8.2 in your Course Manual as a reference. |
Problem
How confident are you in your answer? Can you reliably predict the effect of EDCs during a new time period or in a new geographic region? How do scientists determine a level of confidence for a particular outcome or prediction? Depending on whether you have been assigned to Group 1 or Group 2, focus on the data which are presented in Figure A or B and answer the set of questions assigned to your group.
Group 1 (Figure A)
After all groups have discussed the questions above, return to the question orginally asked: Do EDCs have primarily a feminizing or masculinizing effect on cricket frogs? Can you provide an answer in which you are confident?
|
 industrial
chemicals, pesticides, and surfactants that infiltrate air, soil, food,
and
water. Although controversy exists regarding
the linkage of endocrine
disruptors to negative impacts on human health, it is evident that
these
compounds are present on a global scale with high levels occurring in
the blood
or body fats of humans and wildlife, even in remote areas of the arctic
(Polischuk et al. 1995; Soto et al. 1995).
industrial
chemicals, pesticides, and surfactants that infiltrate air, soil, food,
and
water. Although controversy exists regarding
the linkage of endocrine
disruptors to negative impacts on human health, it is evident that
these
compounds are present on a global scale with high levels occurring in
the blood
or body fats of humans and wildlife, even in remote areas of the arctic
(Polischuk et al. 1995; Soto et al. 1995). Exposure to
EDCs has been listed as one of the causes of the decline in amphibians
over the past decade.
Exposure to
EDCs has been listed as one of the causes of the decline in amphibians
over the past decade. 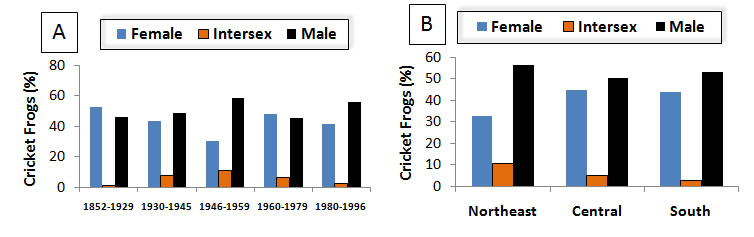
|
References
Cited Soto AM, Sonnenschein C, Chung KL, Fernandez MF, Olea N, Serrano FO 1995. The E-SCREEN assay as a tool to identify estrogens: an update on the estrogenic environmental pollutants. Environ. Health Perspect. 103:113-122. Reeder et al. 2005. Intersexuality and the cricket frog decline: Historic and geographic trends. Environ. Health Perspect. 113:261-265. |