|
|
|
|
Lab2. Resistive Displacement Measurements
Displacement measurement is one of the most used engineering measurements wherever an object motion is involved. Several other measurements, such as position, velocity, acceleration can be calculated based on measuring the displacement data from a transducer that is connected to the object in motion. The displacement measurement transducers could be developed based on resistive, capacitive, inductive properties of the sensor. Others are based on the properties of a medium wherein a wave propagates, such as a sound or electromagnetic waves, i.e. radar, laser, as well as acoustic waves. Here, we introduce a resistive measurement by using a sliding potentiometer that is interfaced to the computer with an Arduino Uno board. We will control the board through python by using the pyfirmata library as we did in Lab 1. ultrasonic technique to measure distance, plot it in real time, and save data for later statistical analysis with Python.
Objectives
This lab has several teaching objectives such as: a) exposing students to engineering measurements with analog transducers; b) showing simple programming concepts for measurements; c) performing a calibration of the transducer; and d) introducing the statistical analysis for accuracy and explaining potential outliers of acquired data.
Displacement measurement is one of the most used engineering measurements wherever an object motion is involved. Several other measurements, such as position, velocity, acceleration can be calculated based on measuring the displacement data from a transducer that is connected to the object in motion. The displacement measurement transducers could be developed based on resistive, capacitive, inductive properties of the sensor. Others are based on the properties of a medium wherein a wave propagates, such as a sound or electromagnetic waves, i.e. radar, laser, as well as acoustic waves. Here, we introduce a resistive measurement by using a sliding potentiometer that is interfaced to the computer with an Arduino Uno board. We will control the board through python by using the pyfirmata library as we did in Lab 1. ultrasonic technique to measure distance, plot it in real time, and save data for later statistical analysis with Python.
Resistive Sensors and Measurement Setup
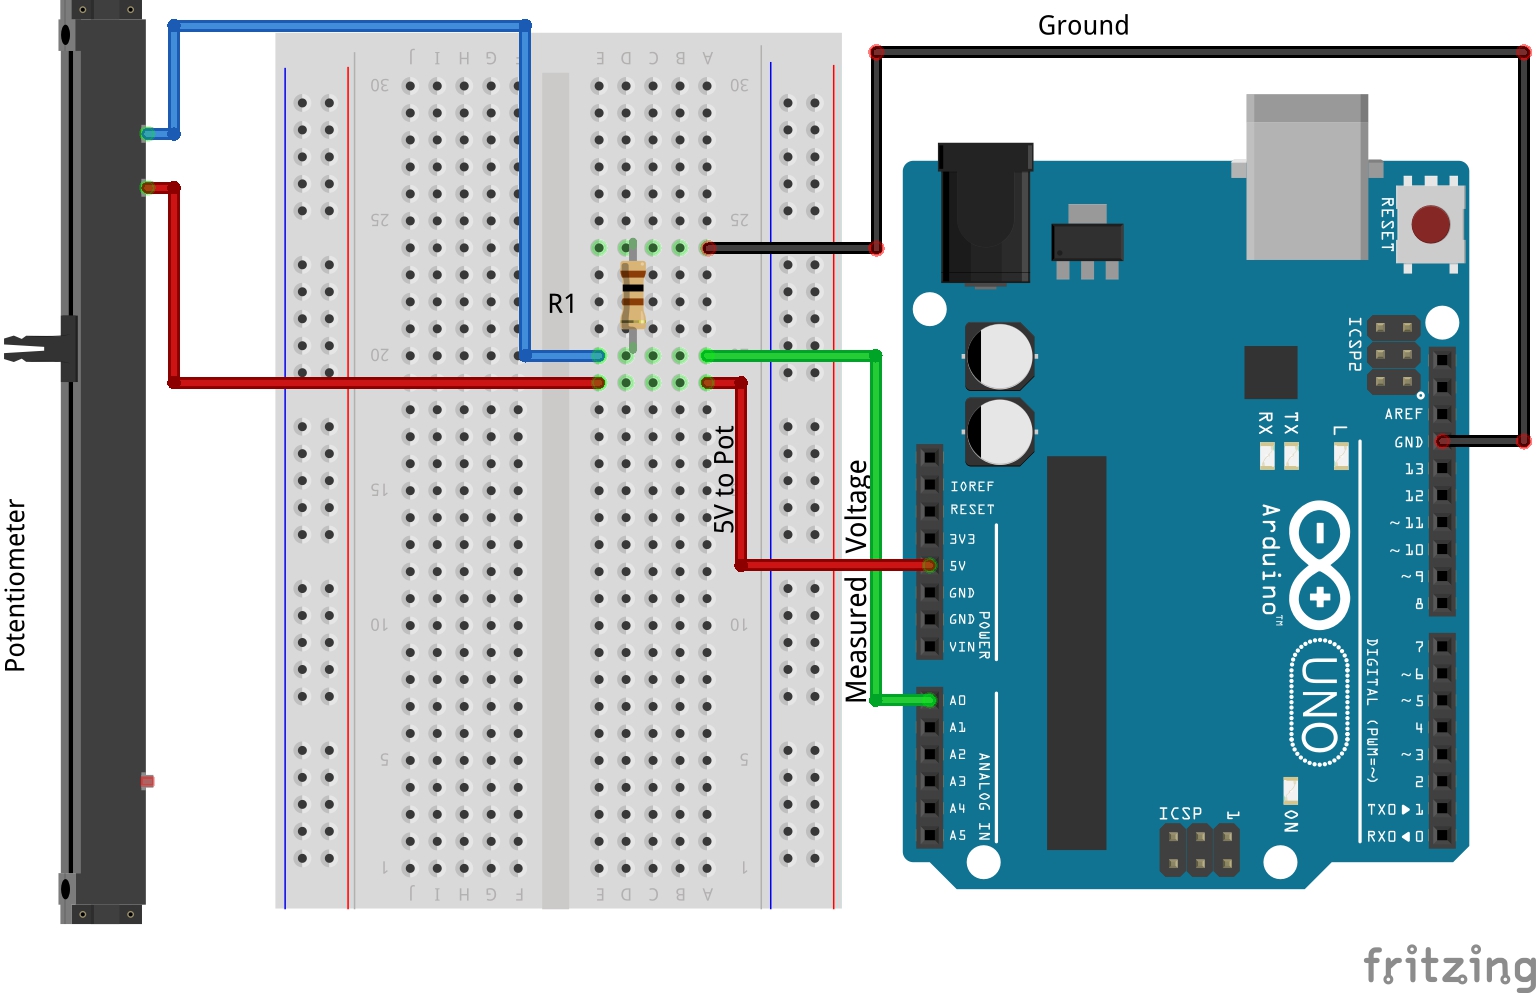
One simple and cost effective transducer for displacement measurements is a variable resistor, i.e. a potentiometer, either in a rotary or sliding configuration. For our simple heuristic application of displacement measurements we use a sliding potentiometer of 10 kΩ. The sliding element of this variable resistor can be connected straight to the 5V pin of the Arduino board. One of its end pins can be connected to on of the ground pins of the Arduino board. In order to acquire voltage measurement from this end pin we use a small resistor of 100 Ω or so, to separate it from the ground connection, otherwise the voltage reading will always be zero. The wiring setup is presented in the following diagram
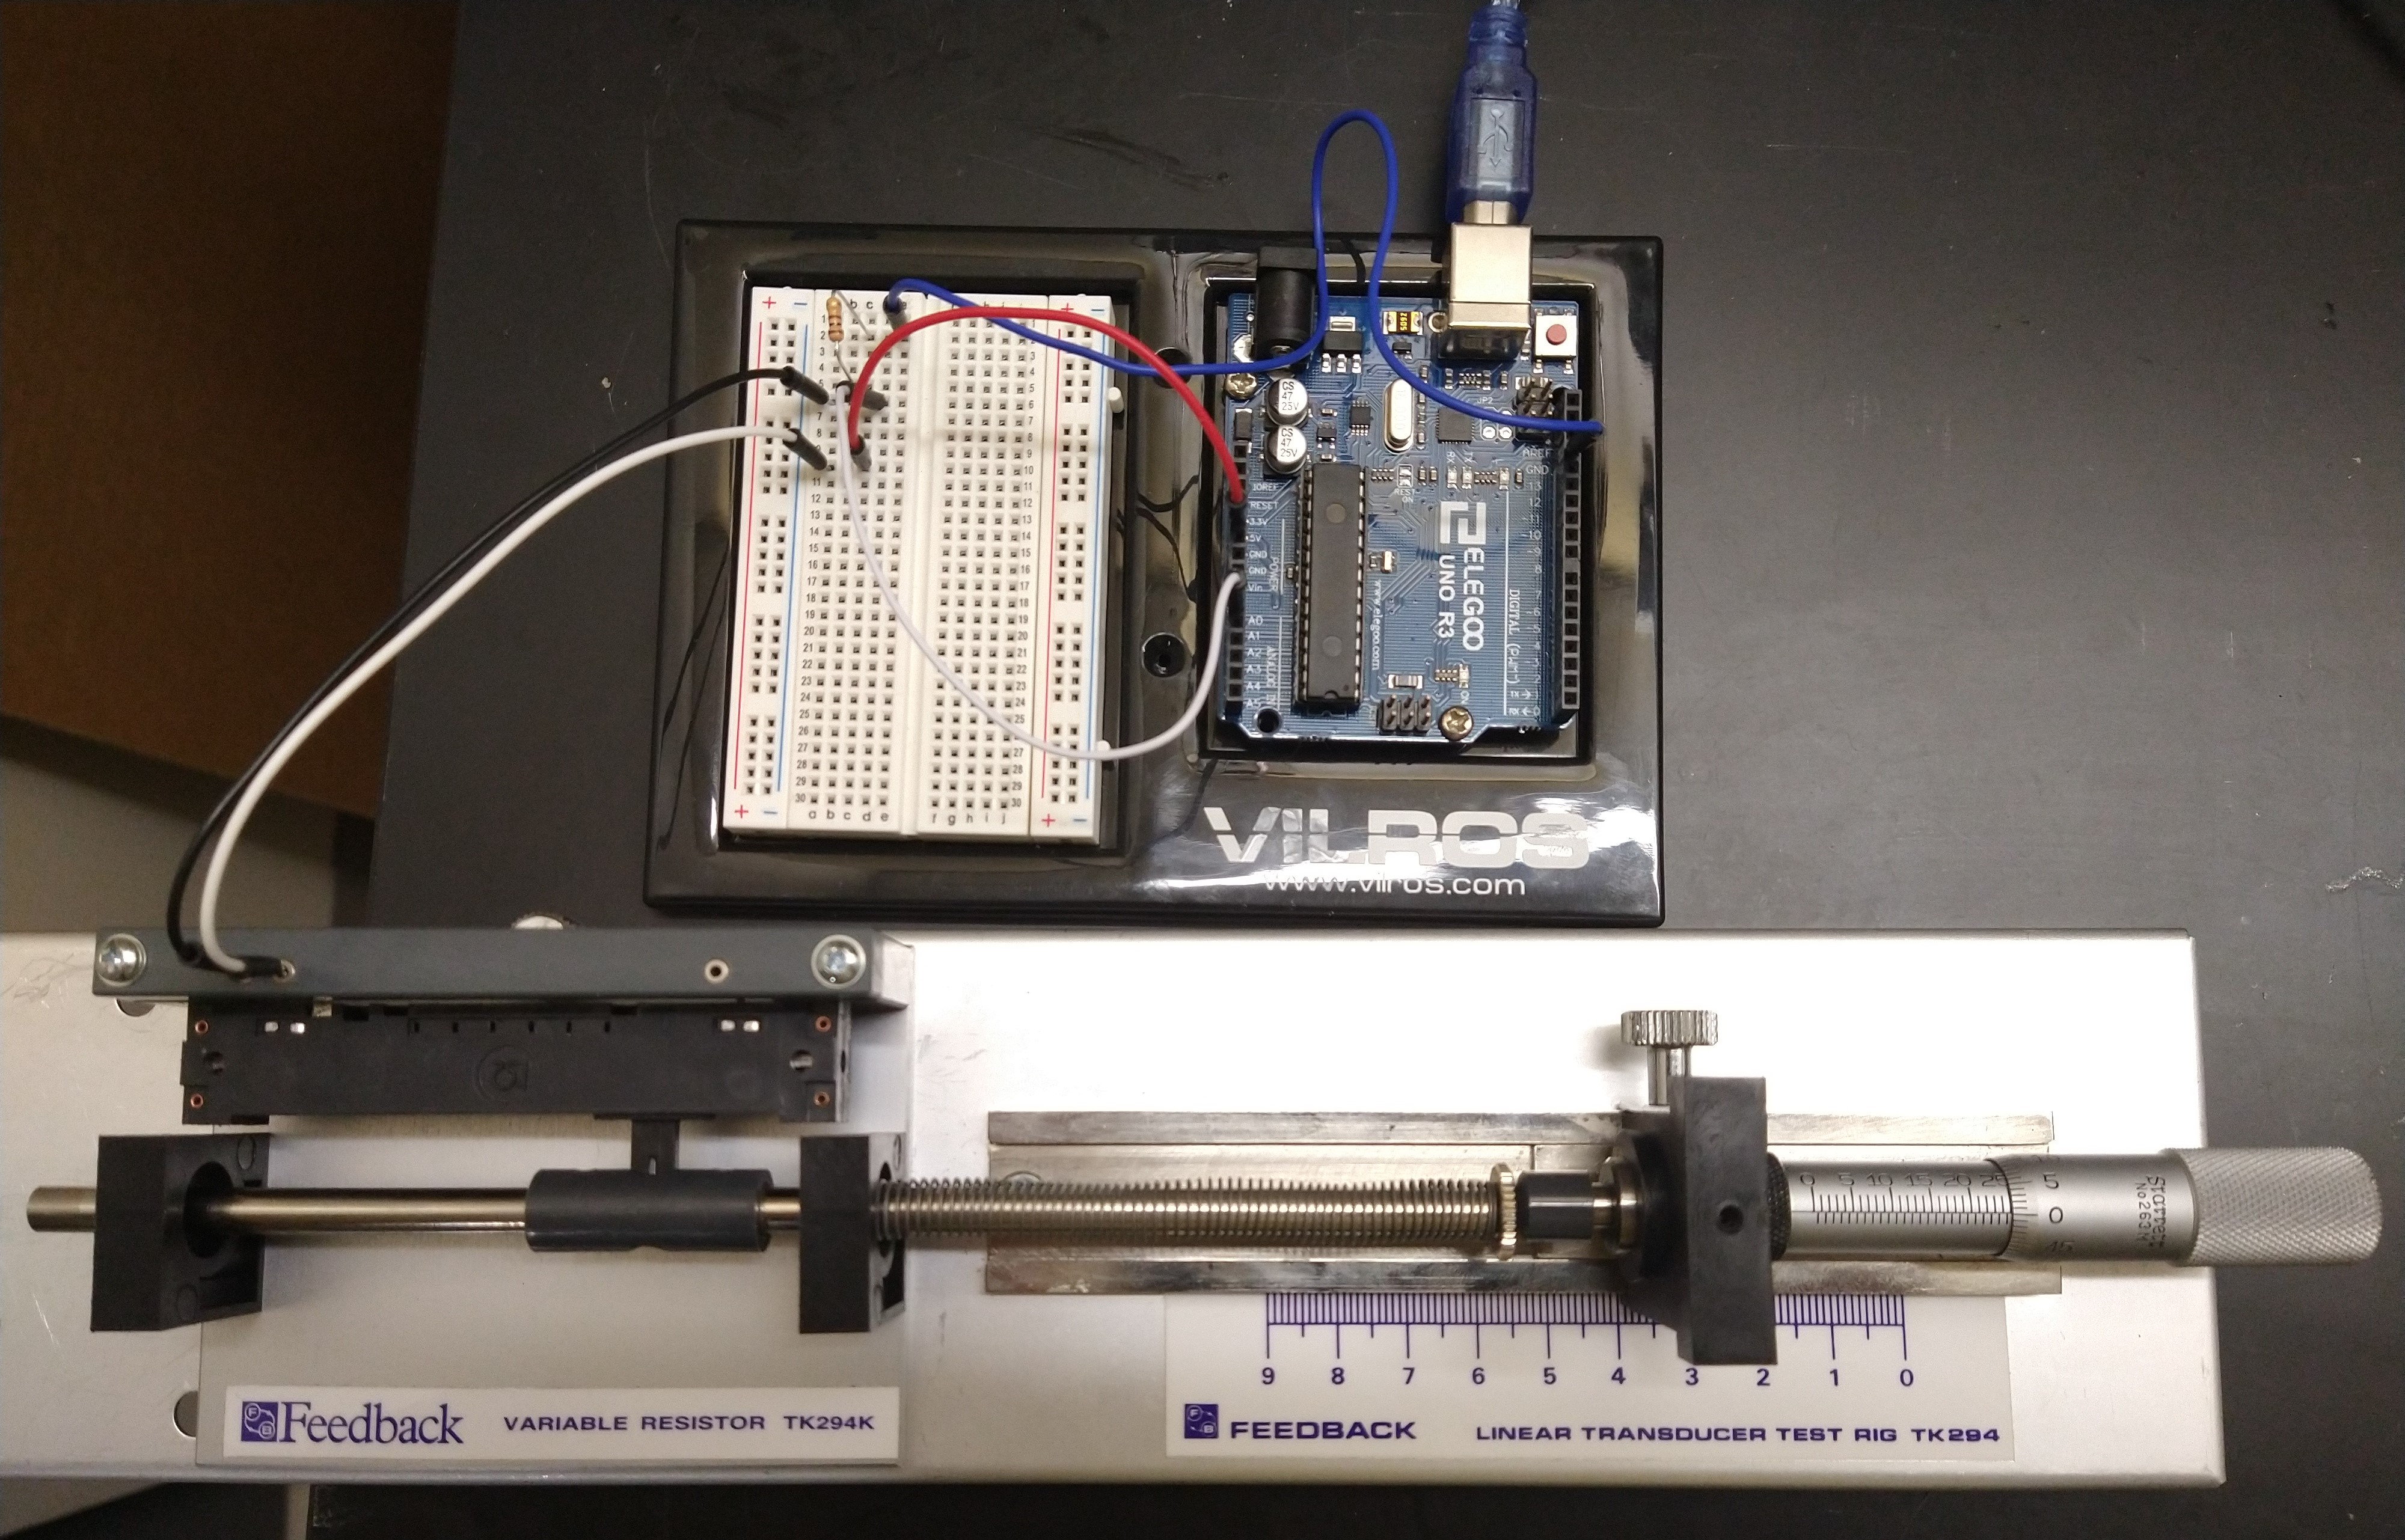
To conduct measurements and also have a true value of the displacement, we push the plunger of the sliding potentiometer with the help of a micrometer as seen in the following picture of the setup. To get measurements, one can rotate the micrometer to push the potentiometer with a certain displacement. This micrometer has only a travel of 25 mm (or 1 inch). Thus, we can set steps of 2.5 mm to acquire a good amount of data points for calibration purposes.
The following video shows how we can take measurements based on this experimental setup. It explains some of the problems and a little about the code that we use to acquire voltage measurements as we displace the plunger of the potentiometer.
Python Script
The Python coding is based on the Lab1d_Measure_Continuously_Plot_andSaveData.py that was modified
to measure distance and calculate displacement. Like in the first lab, we intend to use the pyfirmata library
to simplify the programming part of these measurements. The program generates automatically a displacement array
with a step of 2.5 mm in increasing order from 0 to 25 mm and backwards to 0 mm again. This is done to simplify
the our work during measurements and help us to focus on moving the plunger by rotating the micrometer with 5
revolutions for each step of 2.5 mm. A beep sound is produced by the computer to give the signal to start moving
the micrometer. It tells us that it finished collecting data from the current position and we have a 15 seconds time
to move to the next measurement position. This is a simple and elegant solution to conduct measurements during a
preliminary research phase of any engineering project, as it does not require any complicated automation hardware.
To run these measurements, please copy and paste the following python script on your computer. If you get an error
of miscommunication with the Arduino board, then you might need to set the COM port value, seen here at line 41 in
this python script. One way to find this COM port value is to get it from your
Arduino software: start Arduino IDE>Tools>Port#. For this you need to have your USB cable of the Arduino board
plugged into your computer.
# File: Lab2_Measure_Displacement_with_Resistive_Sensor.py
# Written by George Bunget during Measurements Class, EGR 390, at Murray State University

# -------------------- Goal -------------------------------------
# Adjust the Lab1d_Measure_Continuously_Plot_andSaveData.py to measure
# displacement
# by using an sliding potentiometer

##------------- Outline of this short code (pseudocode) -----------------
##    1) Import needed libraries such as pyfirmata, time, and numpy
##    2) Connect to the board and set pins for measurement (reading)
##    3) Define a function in python that will plot our measured data in
##        real time
##    4) Acquire Voltage and Displacement data and plot them
#           *Move the slider of the potentiometer in steps of 2.5 mm
#                - rotate the micrometer with 5 revolutions
#                    - one revolution is 0.5 mm
#           * acquire 10 data points at each position
#           * plot the 10 points
#                - python will generate an array of displacement values
#           * make beep sound to tell us that the points were acquired and
#             that we can move the micrometer to the next position
#                - also give us time to move in the next position
##    5) Save data in a spreadsheet, a comma separated file, .csv
#----------------------------------------------


##    1) Import needed libraries such as pyfirmata, time, and numpy, etc.
##=============================================
from pyfirmata import Arduino, util
import time
import numpy as np
import matplotlib.pyplot as plt #import plotting library
from drawnow import * # import all functions within the drawnow library.
import winsound # to give us the beep sound - signal that we can move the plunger


##    2) Connect to the board and set pins for measurement (reading)
##=============================================
board = Arduino('COM3')

# Now, we use util to start an iterator that allows us to read from the board
iterator = util.Iterator(board)
iterator.start()

time.sleep(1.0)# wait 1 sec. Sometimes this helps to give time for communication
               #in order to get an actual value and not get 'None' value

# Define the pins that we access
Voltage = board.get_pin('a:0:i')# assign the analog pin 0 as an input to
                                ## measure the voltage drop on the potentiometer


##    3) Define a function in python that will plot our measured data in real time
##===================================================

def Figure():
    plt.plot(DisplArray,VoltageArray, 'bo-', markersize=5) # we plot with blue
    # color and round markers for each
                              # data point
    plt.xlabel('Displacement, [mm]')
    plt.ylabel('Voltage, [V]')
    plt.grid(color='gray', linestyle=':', linewidth=0.5)

# -------------------- Prepare Plotting in Real Time ----------------------------
VoltageArray = [] # create empty array that will fill in with every new data point
DisplArray = []         # create an empty array for time axis

# --- Prepare Beep Sound indicating that we can move rotate our micrometer ----------
frequency = 1000  # Set Frequency To 1000 Hertz
duration = 500  # Set Duration To 500 ms == 0.5 second


##   4) Acquire Voltage and Displacement data and plot them##===============
value = 10
Displ = 0.0
index = 0

while(index <=20):
    print('index = ',index)
    print('Displacement = ',Displ)
    for x in range(value):
        Measured_Voltage = Voltage.read()# measure the voltage drop on potentiometer
        ActualVoltage = Measured_Voltage*5.0# convert to actual volts
        VoltageArray.append(ActualVoltage)      # Load distance point in our DataArray
        DisplArray.append(Displ)          # insert the absolute time value into the Time array

        print('Measured Voltage = ',ActualVoltage)

# ==== Build the Displacement Array
    if index <= 9:
        Displ = Displ + 2.5

    else:
        Displ = Displ - 2.5

        # Make a beep sound in Python
    winsound.Beep(frequency, duration)

    drawnow(Figure)
    plt.pause(0.01)

    time.sleep(15) # python waits 5 seconds for you to displace the micrometer
    # 2.5 mm, i.e. 5 revolutions
    index = index + 1

##    5) Save data in a spreadsheet, a comma separated file, .csv
##============================================

# We need to take the two line arrays, Time and VoltageArray, and join them
# together to form a 2D array with Time as first column and Voltage as
# second column.
# The savetxt function uses a format with 3 decimal points, i.e. fmt="%1.3f"
data = np.stack((DisplArray, VoltageArray), axis=1)
print('Data ', data)
np.savetxt('Displacement_Measurements_Replicate1.csv',data,delimiter=",",
 header="Time [s],Voltage [V]", fmt="%1.3f", comments='')
Post-Processing Data
Most, if not all engineering measurements, require some
level of data post-processing. Sensor calibration is considered as one of the first data processing
technique used in engineering practice. This is the case as most transducers provide
voltage values. However, we are interested in measuring physical properties, such as distance,
displacement, temperature, velocity, acceleration, etc.. For our measurements of
this lab 2, we produced a displacement of the resistor plunger and measure its
voltage. Yet, the practical application of this setup will is to measure
displacement and not voltage. Therefore, the engineers use the calibration
technique to transform voltage into displacement.
Other post-processing techniques are related to signal
filtering, feature extractions, and/or statistical analysis of measured data.
These data post-processing techniques will be discussed in the next lab, Lab 3.